
The United States of America has reached full employment-that sought after term used by economists that describes an unemployment rate where all who are able and willing to work, are working. Though the actual number that represents full employment varies based on who you ask, it’s around 5.5% or less. That’s where we are.
This month, Americans attained a massive achievement. In a long fought journey back from the depths of recession, we’ve traveled from 10% unemployment, a rate not measurably exceeded since the Great Depression, to full employment. Every single day of reduction of unemployment since the Great Recession of 2008-9 has taken place under the Obama administration. During this same time, our federal deficit spending, as a % of GDP has shrunk to its lowest point since 2005-lower than all but one year in the Reagan and first Bush administrations combined, lower than the first term of the Clinton Administration. These are facts supported by raw data that has been collected by consistent, non-partisan means for decades. These numbers of economic strength are hard to argue with, on a macro-economic scale. But for some reason, most Americans don’t feel that good about the direction of the country-in economic perspectives. Even our most fervent optimists admit, it doesn’t really feel like full employment. But why? You could dismiss the sentiment as a result of partisan bickering in an election year-one covered on an unprecedented scale by the largest media market in the history of mankind, accelerated by our current social media environment. You could do that. Or, you could take a deeper look at the data. We did the latter.
That Data
There’s no shortage of data to be found on topics that people care about these days. But you have to be careful with who is supplying it to you. Political organizations, even those that don’t sound political but actually are-think tanks, policy centers etc., tend to start with a point and then find the data to confirm it. If you’re serious about data though, and you are interested in understanding instead of confirming, you start with the data. The confirmation comes later.
The Bureau of Labor Statistics is a virtual treasure trove of data. And if you take a look at two massive surveys they collect, the Occupational Employment Statistics Survey (OES), and the Current Population Survey (CPS), you can see the detail on job categorization, population, pay and employment status in raw form. That’s exactly what we did. What we found was a very clear and compelling.
Unemployment
You’ve heard President Obama himself tout the massive reduction in unemployment on his watch. If you’ve paid attention to the Republican presidential primary race, you’ve also heard the counter-point that the impressive number is a “fake” number. And that behind it, hides significant problems with people who have quit looking for work or people under employed. So which one is it? The good news is, the CPS, which is a monthly survey consistently delivered since 1994 and scientifically managed to be statistically significant, actually tracks that stuff. What does it say? Well, it says that the President is right. We have reduced unemployment significantly across all groups, to include marginally attached workers (those who want work and stopped looking) and part time workers.

It’s not 5.5% like the pure unemployment number, but it’s pretty much back within normal range of our pre-recession levels. Unfortunately for the opposition, but fortunately for the country, people are finding jobs-full time jobs-again. And the trend is continuing to improve every month.
Job Category
So if we’re getting jobs, clearly they’re not good ones any more. That’s why people are upset. Right? That’s the voice of discontent from the middle class these days. So we looked in the Occupational Employment Survey to see how things have changed, since the current form of survey started in 1997. Terminology regularly changes here, so we had to do quite a bit of work to broaden it to get to an apples to apples comparison, but here’s what we found.
 Our conclusion is that there has been a little shifting around. But not much. For the most part, over the last 20 years, Americans are consistently working in the same types of jobs. There’s some uptick in management and computers, some shrinkage in agriculture and science, but it’s mostly the same. So what’s going on? Well, when you start to look at income, the picture gets clearer.
Income
When you peal back the overall employment status, number and job type, you can see the income patterns. At the highest level, the American worker is actually out-legging inflation over the last two decades.

The graphic above shows that, as a whole, the American worker makes $626 more a year then they did in 1997 adjusted for inflation. That’s a good thing. So, unemployment is stable, we’re continuing the same types of work we used to do at a macro level, and we’re making more money then we used to. What’s the problem? It’s this. The “we” in that statement above, is fantastically uneven when you move one click down on the income detail.

If you are one of the higher paid job categories, things have been pretty rosy for you the last few decades. White collar and professional jobs have seen their income increase relative to inflation since 1997 significantly. When you look at the management bucket, the second highest paid group behind the much smaller legal industry, you see a massive 20% increase in income for people already making more money then just about everyone else. Hold that thought. Because it will start to help you understand some of the frustration being felt by the other group of American workers shown in the next graphic.
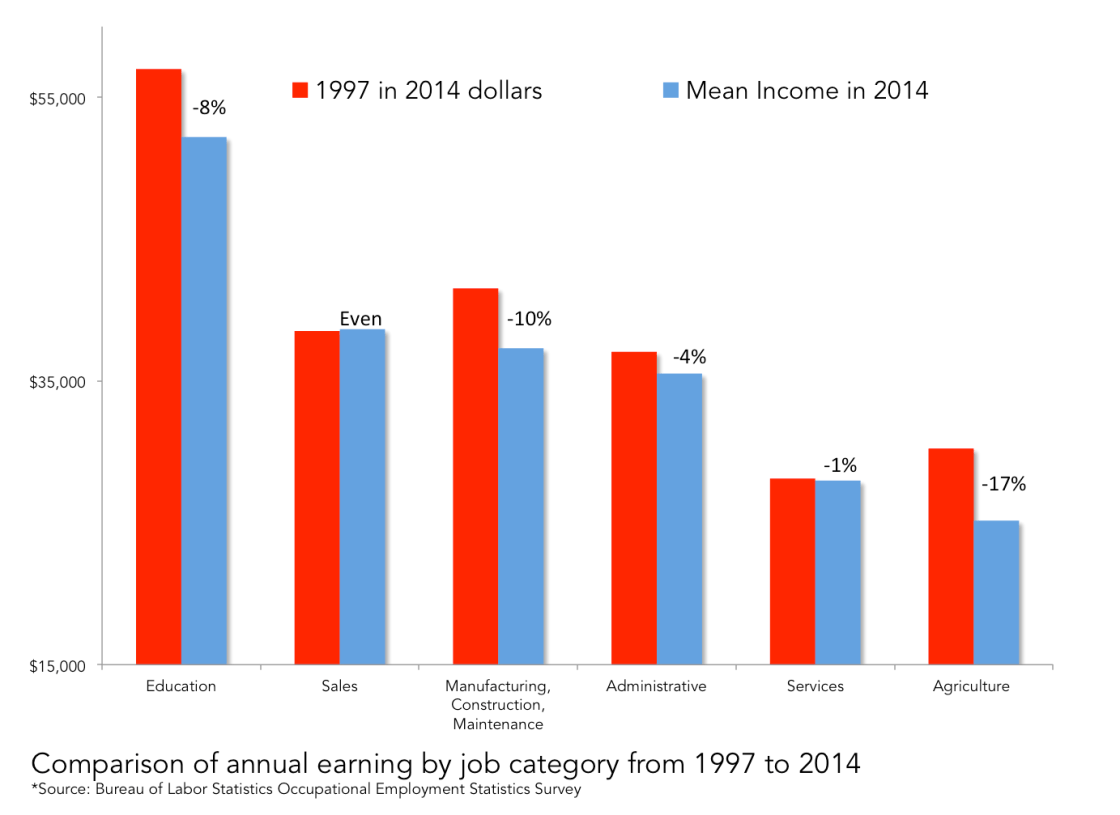
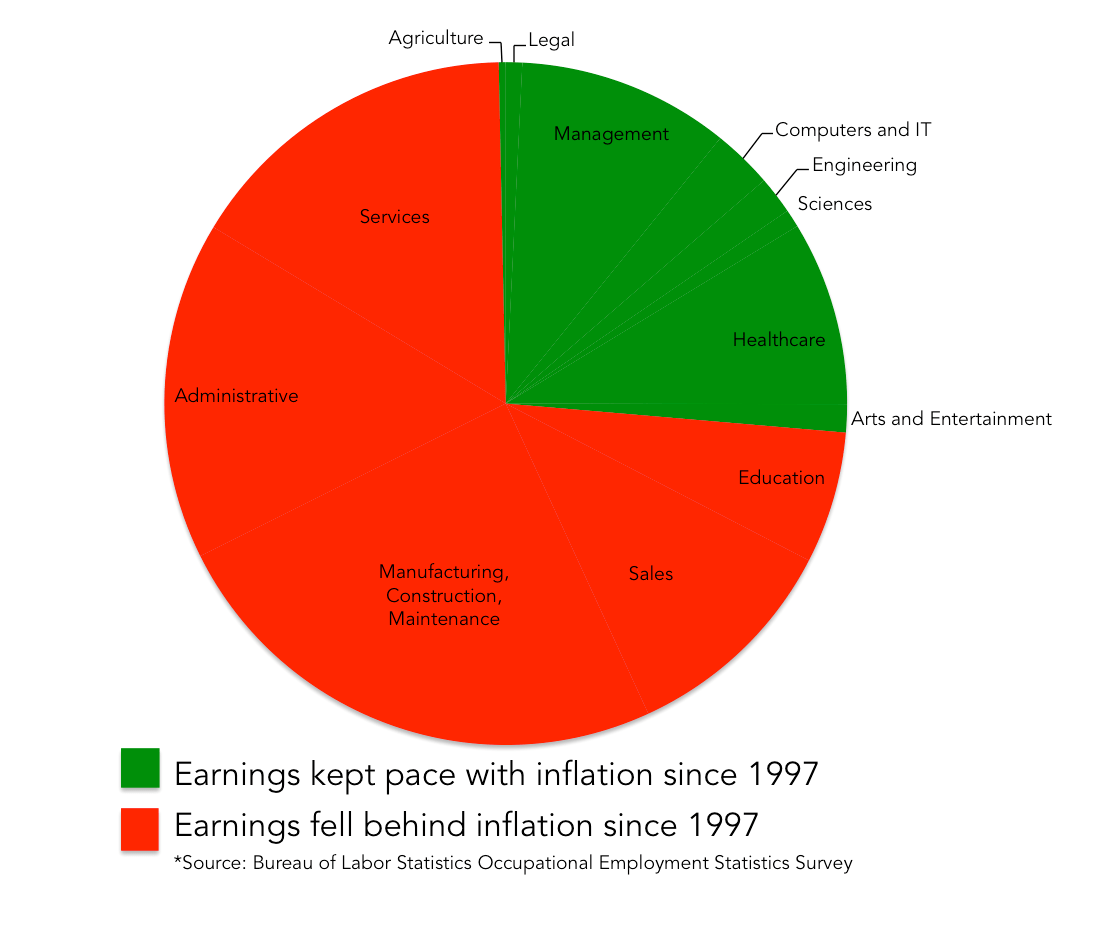
Educators, blue collar workers and service providers are hurting. If you look at manufacturing, construction and maintenance workers, you’ll see that group has seen a 10% pay cut since 1997, despite being the most productive manufacturing workforce in the world, per capita. That group is the largest portion of the American workforce. Roughly one-in-four Americans works there. Our next biggest group, Administrative workers, is down 4%. So when you start to look at that pie chart through the lens of income, the picture actually gets pretty bleak.
There are a lot of Americans, most actually, that are in a worse condition now, then they were 20 years ago, from an employment perspective. Which means there’s a lot of Americans who are justifiably dissatisfied. And the current political environment is quickly taking that appropriate dissatisfaction and throwing gas on it-urging us ever closer to a once inconceivable outcome of a Trump/Sanders presidential race.
People are angry. And I think we’ve done a fair job at showing why they’re pissed. But where should we aim that anger? Which side has it right? Is it Trump angry? Is it Bernie angry? Let’s start with some facts.
Some Facts brought to you by the good folks at Forbes Magazine, the Huffington Post and the United Nations.
- In 2001, China joined the World Trade Organization.
- The average annual salary for a manufacturing employee in China is $7,705.
- The average annual salary for a manufacturing employee in the U.S. is $37,440.
- 22% of the world’s manufacturing is done in China, more than any other country in the world.
- 17% of the world’s manufacturing is done in America, more than any other country in the world except China.
- In 1992, the United States manufactured more goods than any country in the world. China was 6th.
- Companies in the S&P 500 reported over 30% profit growth in 2012.
- During that same time, employment in those companies shrank by 1M jobs.
- Over the last decade, corporations in America have increased employment in countries other than America 30%.
- According to Moore’s Law, computer processing capacity doubles every year.
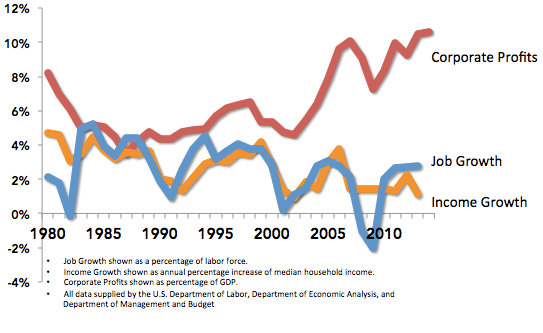
There’s a lot that goes into why the economic outlook has changed over the last two decades. You’ll find most of your major culprits somewhere in that list though. And though you could throw the catch all, “because that (insert political figurehead) has ruined America, we’re so unfriendly to business, all the jobs are leaving”, I’ll add one more graphic that shows that the business and taxation environment in America has never been greater and that investment in the American workforce during that time has been non-existent.
So what?
Unfortunately for some potential office seekers, economically speaking, you don’t see immigration, the degradation of conservative family values, government spending, Obamacare, welfare or even taxation in that list above. You could try to add taxes in there if you want to. Our corporate tax rates (35% max) have been the same since 1994, and haven’t been lower since 1941. So you would be wrong. So why are the people that are most impacted by this shift so angry at those things? It’s a really hard thing to explain. But I’ll give it a shot.
Most of the things that have driven a negative shift in the quality of life for middle class Americans are events driven by innovation and free market capitalism. So we’re stuck with a choice between being angry at something we don’t know how to be angry at and being ok with our lives being worse then they used to be. We do neither willingly. So, like an unhappily married couple, working class Americans have taken to blaming their outcomes on the things we really know how to get angry with. Things like inequality, racial injustice, immigrants, people who are different, whoever is in charge. Did I say people who are different? Burn the witches because the crops have failed. We’re humans. This is what we do. And it’s not new. So we’re doing it in spades. We can’t get mad at free market capitalism and innovation, but we can get mad at something.
What do we do about it?
This is where you have to be careful. Using the impacts of free market capitalism to explain a negative economic outcome and claiming that free market capitalism is bad are not the same things. Capitalism is good. Right now, though, it’s not good for the American middle class. It’s improving the middle class of developing countries at an unprecedented rate. And that’s good. Because it promotes global societal health and stability. And though people are screaming about how dangerous the world is today, coming off a century of near global nuclear war, multiple world wars and the spread and then failure of communism, ISIS is a relative lightweight compared to the demons of our past. We’ve never been safer. But we’ve still got a problem. Our middle class is hurting. And the data shows it’s real pain. And it has nothing to do with whatever party is in office.
So what do we do about it? Well, unfortunately for most of the working middle class folks who identify as conservative, you’re not going to like the answer. The types of things that tend to solve the problems of employment income and de-insdustrialization tend to look like government intervention in the economy. And that’s a little scary. But I’d like to start a discussion on solutions and outcomes. This is what that sounds like. Here are three things I would like to see help the middle class.
- Increase in public works projects that will overhaul our deteriorating infrastructure (see Flint, MI) and create high paying jobs for skilled laborers that can’t be outsourced.
- Decrease the burden of healthcare costs for all Americans.
- Incentivize private sector investment in the American workforce or levy higher taxes on their record profits. Doing neither is bad for America.
Now, I assume that many people will object to these proposals. Especially the #3. That’s scary stuff. But we’re in uncharted ground and it’s not going to fix itself. I even assume that the very people who this will actually help will also object to them in the name of principal. But what I’d ask of those who do is to demand that your candidate provide an alternative solution to the very real problems of the American middle class. And don’t settle for the nonsense designed to channel your focus and frustration at things like immigration, rich people, Muslims, gay people, cops or the poor. They have nothing to do with it, no matter how much you want them to. If we’re going to get better than we are, we have to be better than that. And we’ve got real problems to solve.
